Hypothesis Testing on a Continental Scale: GPU-based Time Series Classification
Adriaan van Natijne (see his website) noticed that the Graphics Processing Unit (GPU) can be readily used in Python to impose many models through Least-Squares Estimations (LSE) simultaneously. This turned into a shared hobby project which ultimately ended up on a symposium of the Netherlands Center for Geodesy and Geo-Informatics (NCG Symposium 2024) at the Delft University of Technology due to a number of firsts.
Adriaan downloaded the complete EGMS L2b (calibrated; 2018-2022) which contains about 9.4 billion deformation timeseries spread out over Europe. We imposed 3724 models on each timeseries to 1) find the best model and 2) extract meaningful model parameters such as velocity, acceleration, seasonality and, most importantly, breakpoints. This contrasts the EGMS display and analysis, which assumes one and the same model for all of Europeans deformation timeseries. To figure out the best model, we used hypothesis testing, namely the Overall Model Test (OMT). Practically, this comes down to approximately 350 trillion(!) model evaluations and since we were doing this in our own time, we had no support or funding. We used the GPU and highly optimized the code to perform this colossal task. After a few attempts, we made the difference, evaluating 20 million(!) model evaluations (including I/O) per second on a simple consumer laptop, completing the task within 20 days.
The visualization of the results was another challenge, however rewarding. A summary overview of the model types that were deemed best most of the time in within each fixed pixel region is shown in the European map on this page. We can see that combination of a model with offset, velocity, acceleration (regular; blue) and a model seasonal components (seasonal; green) fits best most of the time as most of the map is cyan. However, within deformation analysis, anomalies are of primary interest. You could think of downward jumps in timeseries due to e.g. sinkholes as an example for such an anomaly. Such behaviour will not show up as blue, green or cyan, but instead as red, magenta, yellow or white. You can see that anomalous behaviour is dominant in region(s) in central Italy, Iceland and Scandinavia.
We also found that about 61% of all the timeseries did not pass the OMT with any of the 3724 models. From that we suspect that the EGMS has underestimated the standard deviation of the deformation observation. Apart from that, we are able to indicate jumps in timeseries on a local level too. This has been visualized on egms.geotiles.nl.
The work was partially inspired by Kulshrestha, A., Chang, L., & Stein, A. (2022). Use of LSTM for sinkhole-related anomaly detection and classification of InSAR deformation time series. IEEE Journal of selected topics in applied earth observations and remote sensing, 15, 4559-4570. doi:10.1109/JSTARS.2022.3180994
Update: this work was continued, expanded, improved and accepted at the Living Planet Symposium 2025 in Vienna, Austria. You can read more about it here.
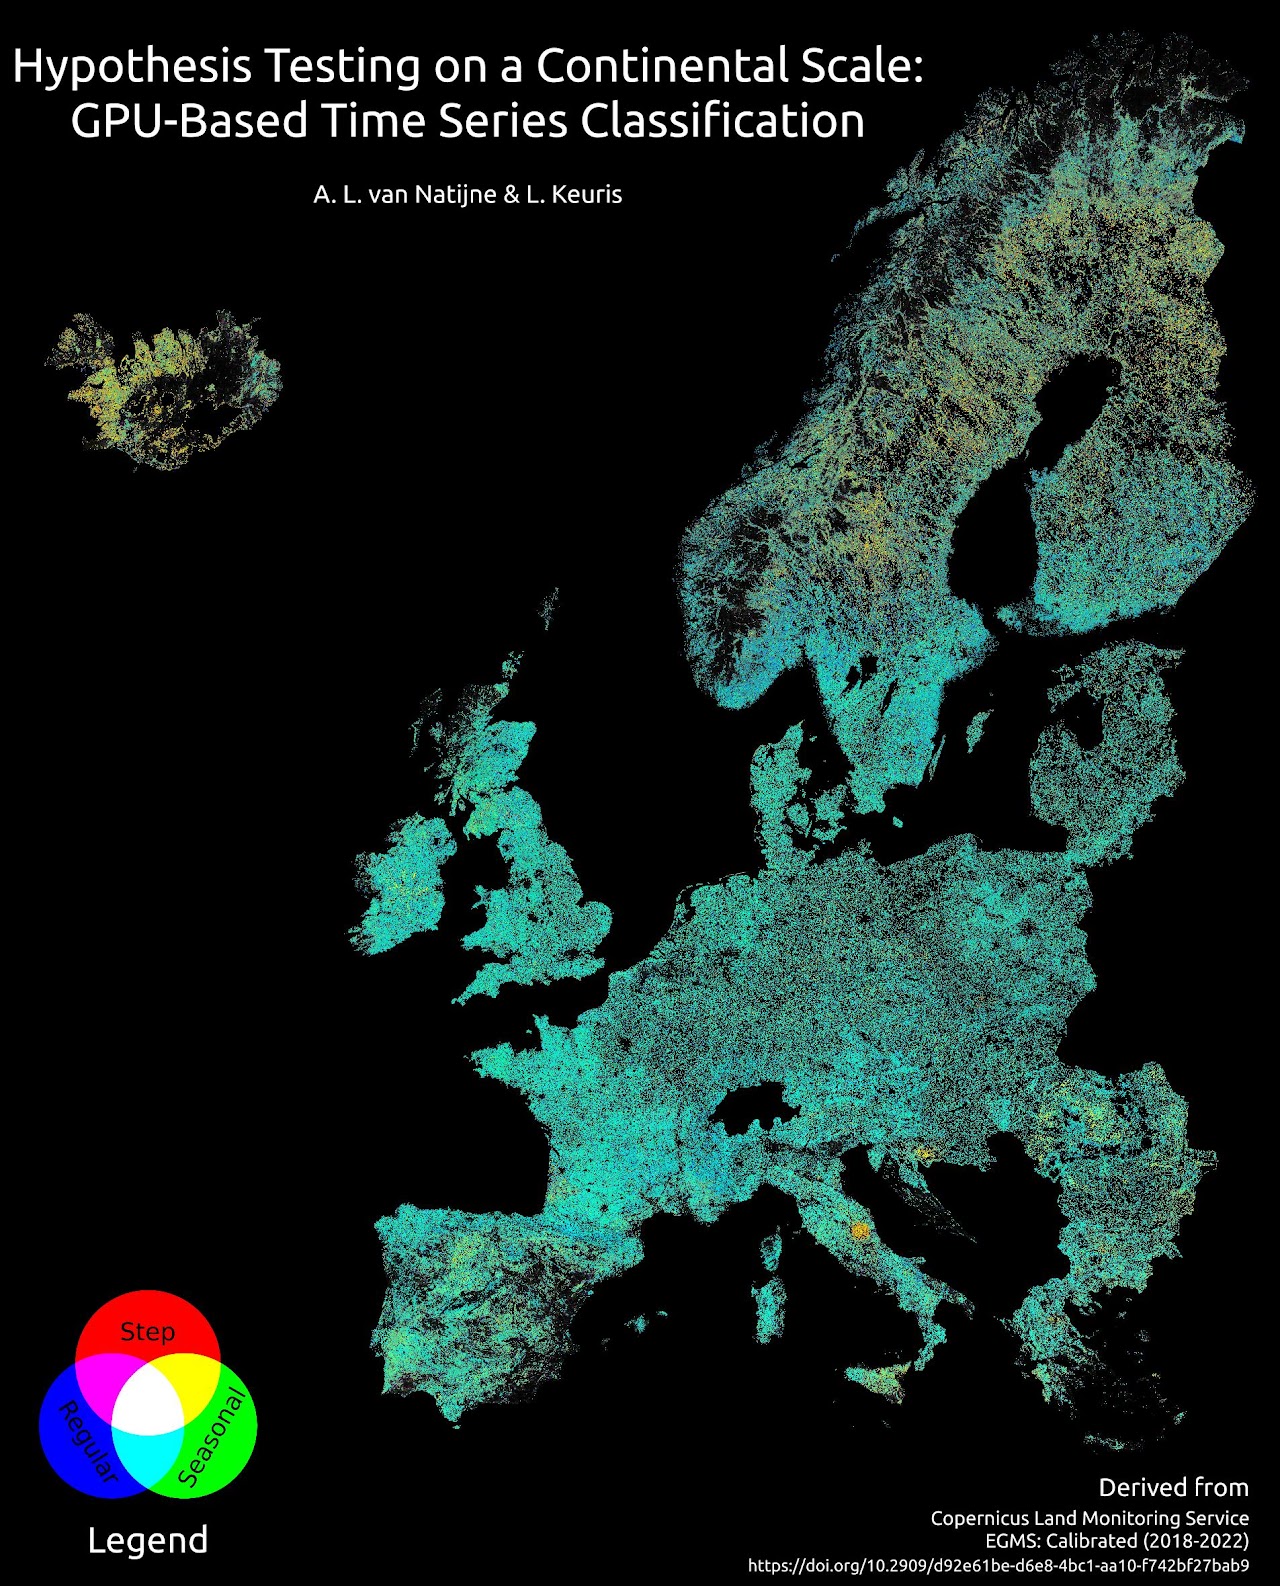
Poster of the work presented at the NCG Symposium 2024 at the Delft University of Technology.