Sentinel-2 Enchancement
Sentinel-2 has been featured a few times in the portfolio page of this website and it has taken a prominent position in the Earth observation discipline. There are plenty of reasons for that, for instance, its long mission duration, the number of satellites, its extensive and thorough future planning, its open access and its radiometric, spatial and temporal resolution. For the Netherlands there is however a gap when it comes to those types of resolutions between the available aerial photography (bi-annual, 4 radiometric bands with a sub-meter spatial resolution) and the Sentinel-2 mission (every few days, 13 radiometric bands with a 10 to 60 meter spatial resoution). The Netherlands Space Agency does provide SuperView NEO imagery mosaics combining several months of data with, also with a sub-meter spatial resolution, with up to 8 radiometric bands. Effectively the NLSA provides 6 full coverage SuperView maps annually. These maps are however not ideal for its radiometric exploitation, because of the mosaiced nature of the map (varying atmospheric conditions and radiometric responses of the surface due to the time difference). They could be used, but instead the Sentinel-2 data seems more promising for starters.
The Sentinel-2 documentation (link) provides the point spread functions (PSF) of each Sentinel-2 platform and each band. The PSF data has been downloaded and further investigated. A plot that is very similar to the one in the documentation is shown on this page too. The point spread function shows the spatial sensitivity of a sensor. If the PSF has relatively high values in the center and quickly rolls off to zero away from the center, the PSF indicates a sensor that is capable of distinguishing relatively small objects close to one another. If the PSF rolls off to zero over more blocks, then the PSF indicates a sensor that is less capable of distinguishing relatvely small objects close to one another. The PSF may be related to sharpness in a sense.
The sum of the PSF is one and the highest value of about 0.0299 for Sentinel-2A band B02 is found right in the middle of a pixel. The current product pixel is indicated by the red box (equivalent to 10 by 10 meter ground sampling distance) and sums up to a PSF fraction of 0.5264. That means that about half of the pixel value that you would read in the Sentinel-2 product for B02 comes from the selected pixel. The other half comes from the neighboring pixels (each block of 5 by 5 units in the PSF is a 10 by 10 meter pixel). This PSF is valid for every pixel, which means that the selected pixel also contains information from its neighbors. The pixel on the right of the selected center pixel spreads 0.0959 into the center pixel, and so does the one above the center pixel, etc.. In a way, each pixel is a mix of its neighboring pixels and only the sum of the received radiances (or reflectances) along with the weights (PSF). This poses an unmixing problem. Whenever the reflectances are used to identify underlying characteristics (e.g. vegetation, or any type of land cover for that matter), the unmixing problem may be incorporated to achieve a higher resolution at the same time. This is part of an ongoing investigation.
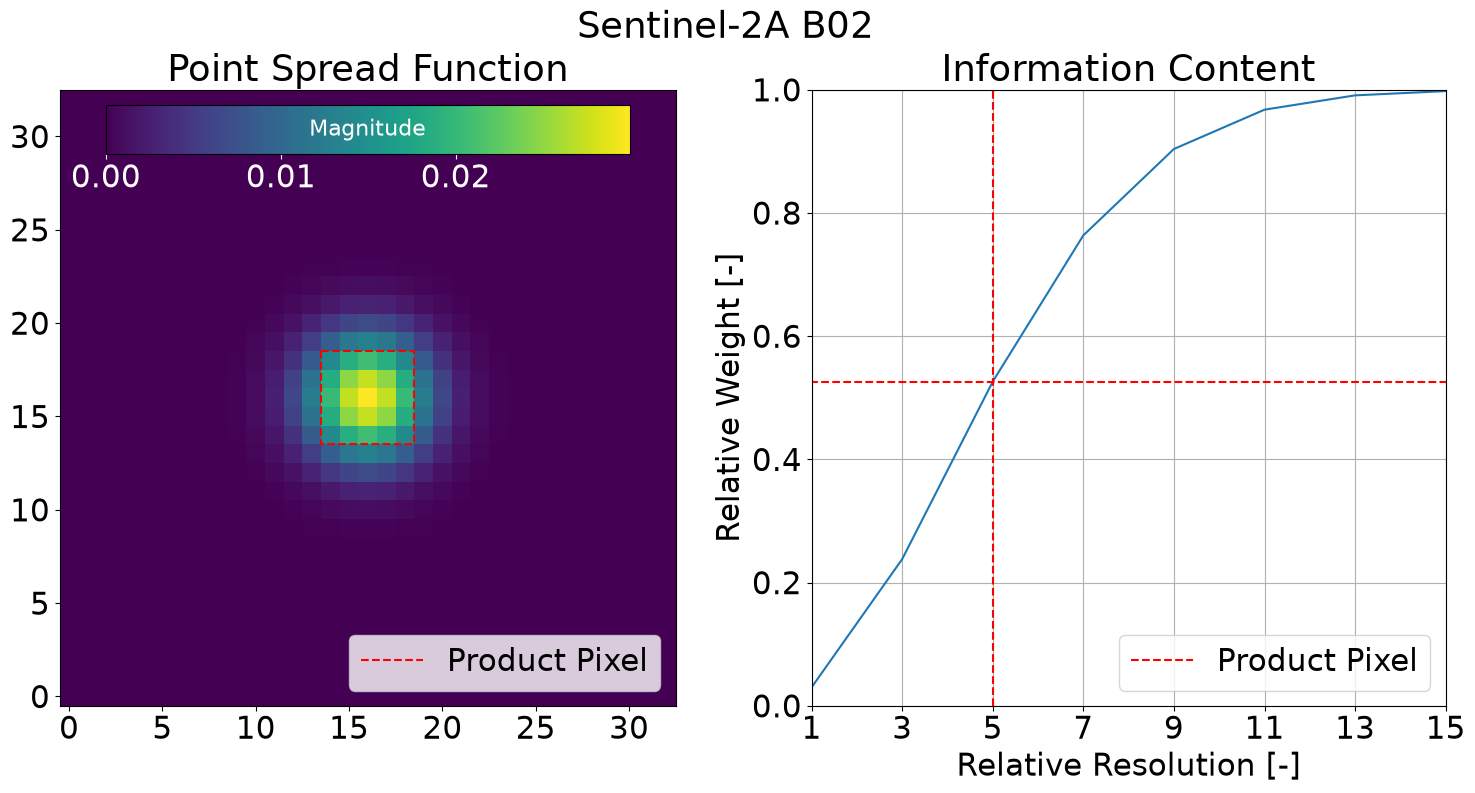
Derived from data available at: ESA SentiWiki.